More Students Attend Public Schools: 2019 Audited Enrollment Analysis
DC PCSB uses OSSE’s audited enrollment report and data file along with its own data on school quality to analyze enrollment trends across the District. Our audited enrollment analysis focuses on the total numbers of students in each school and grade level. We took a closer look at which schools are increasing or decreasing their enrollment at the greatest rates as well as enrollment trends in the highest and lowest performing public charter schools. We also examined how ward-level enrollment has shifted as public charter schools open and expand across the district and where our student population resides. This analysis compares data from SY16-17 and SY17-18 to the current SY18-19.
What is “audited enrollment”? Why does it matter?
Audited enrollment refers to the official number of students enrolled in the District’s public education sector stratified by campus, grade level, and a variety of programmatic and demographic characteristics.
This data is verified by OSSE’s annual enrollment audit, which serves as an annual census for traditional public and public charter students in the District. As the State Education Agency, OSSE verifies which students are enrolled in each DCPS and public charter school. The data acquired in the audit is crucial as it is used as both a basis for funding and data verification. By confirming each student and each school’s enrollment, OSSE ensures: (1) schools get paid for the amount of students they educate and (2) education stakeholders across the District have a common, verified dataset to support their analyses and strategic planning efforts.
What are the implications of this analysis?
Since the 2017-2018 school year, four new public charter schools opened and five schools or campuses began and/or finalized closure. In the face of these changes, there has been an overall increase in enrollment and a steady level of growth in public charter schools in the past year.
TABLE 1 & 2: Public Charter Schools New Campuses & Closures in SY 2018-2019

What are the highlights of this analysis?
Upon stratifying this year’s audited enrollment, we noticed several areas of interest for further investigation, including the growth in middle schools, the decline in enrollment in high schools, and the District-wide decline in enrollment in Ward 8.
Growth in Middle School Enrollment
Middle school enrollment grew significantly across the district, with 1,500+ new 6th, 7th, and 8th graders in the District since SY16-17, with nearly 50% of this growth coming from public charter schools. Despite closure beginning at SEED PCS (middle school) and Chavez – Parkside Middle School in SY18-19, middle school enrollment continued to increase, with the opening of Digital Pioneers Academy PCS and the growth of Creative Minds International PCS. Additional growth in this grade band is expected as Statesman College Preparatory Academy PCS expands to educate students in grades 4-8 in school year 2022-23.
Decline in High School Enrollment
While enrollment for 9th, 10th, 11th, and 12th graders decreased at DCPS schools by 380 students in the past year, it has increased at public charter schools for the past two years, with 50+ more high school students since school year 2017-18. Despite the closure of Washington Math Science Technology PCS in school year 2017-18, public charter schools saw an increase in enrollment, largely due to the expansion of high school grade bands at District of Columbia International School located in Ward 4 and Washington Leadership Academy PCS located in Ward 5. Additional growth can be expected as both of these schools expand to educate 12th graders in school year 2019-20.
Enrollment in Ward 8
Both DCPS and PCS saw a decline in the number of students attending a school located in Ward 8 between school year 2017-18 and school year 2018-19. With the closure of Excel Academy PCS at the end of school year 2017-18, there was a loss of 642 public charter school seats in Ward 8 schools. Furthermore, Rocketship PCS – Legacy Prep located in Ward 7 relocated 106 seats from its Rocketship PCS – Rise Academy school located in Ward 8 in school year 2018-19. DCPS opened Excel Academy in Ward 8 in 2018-19. The expansion of grades at DC Prep PCS – Anacostia Elementary, and Rocketship PCS – Rise Academy in Ward 8 is expected to continue in school year 2019-20, but the closure of National Collegiate Preparatory PCHS remains imminent, with the school closing at the end of the 2019-20 school year.
What does this year’s audited enrollment tell us about the trends in education in DC?
We stratified this year’s audited enrollment using a variety of dimensions, ranging from sector, grades served, grade level, School Quality Report Tier, and ward of school.
CHART 1: Enrollment in Charter Schools & DCPS from School Year (SY) 2017-18 to School Year 2018-19 in DC Public Education Sector

Enrollment by sector
In the 2018-19 school year, there are 43,911 students enrolled in DC’s public charter schools, an increase of 571 students, or 1.3% from the previous school year (2017-18). There are 48,902 students enrolled in DCPS (traditional public schools), representing an increase of 920 students, or 1.9% of DCPS’ enrollment in the 2017-18 school year. Public charter schools serve 47.3% of the District’s public school population, a slight decrease from 47.5% in school year 2017-18.
TABLE 3: Changes in Enrollment by Grade Bands from School Year (SY) 2017-18 to SY 2018-19 in DC Public Education Sector
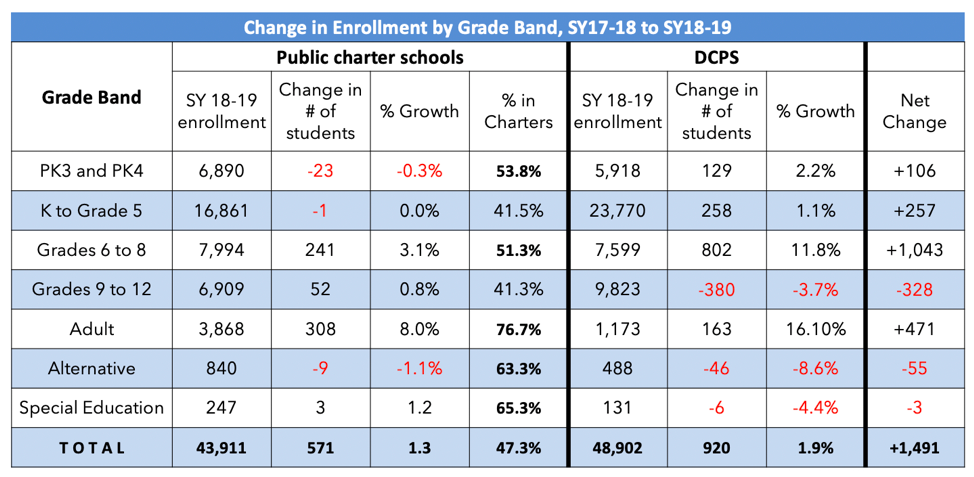
TABLE 4: Changes in Enrollment Share by Grade Band from School Year (SY) 2016-17 to SY 2018-19 in DC Public Education Sector
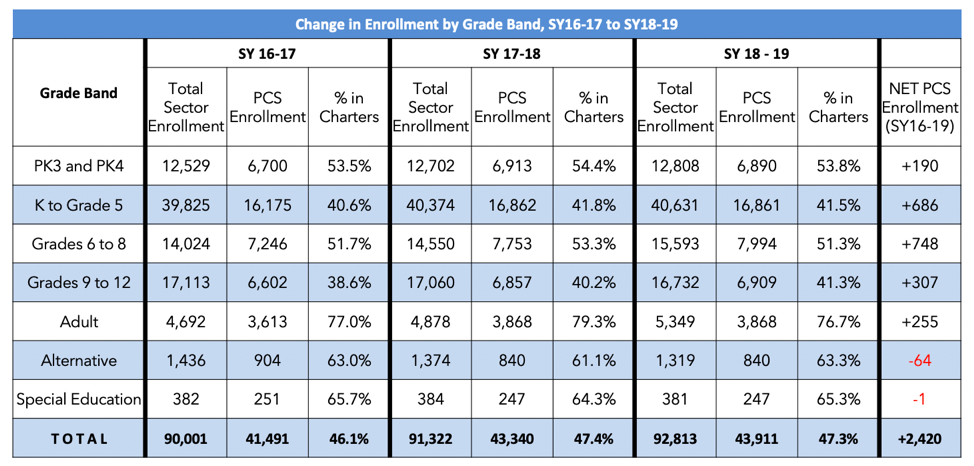
Enrollment by grades
Enrollment in public charter schools increased in middle school, high school, and adult grades and in special education programs as well. While the proportion of students served in public charter and DCPS (traditional public schools) differ across grades, it is important to note that public charter schools have increased their proportional share of service in early education, elementary school, and high school grades since school year 2016-17. Proportional enrollment in middle school grades and special education programs have also remained relatively steady since school year 2016-17. Without factoring in the grades of alternative students, public charter schools currently serve 45.1% of the District’s PK-12 students, a 1.1% increase from SY2016-17.
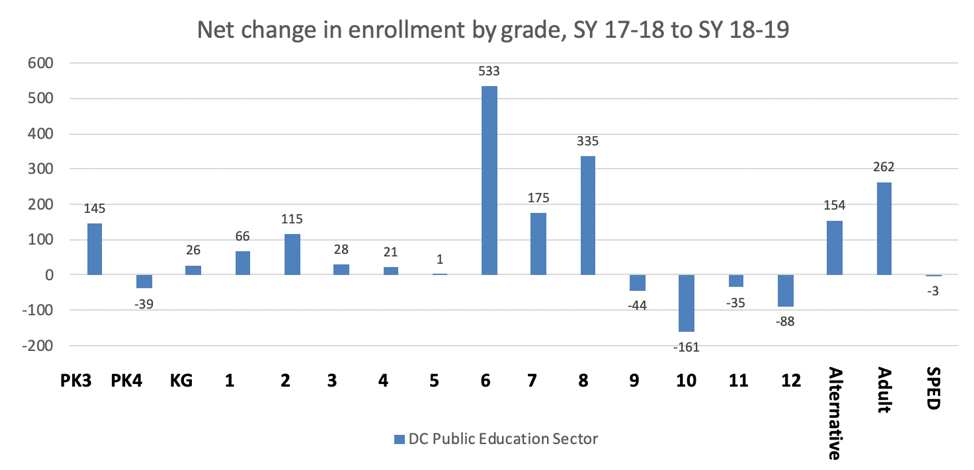
CHART 2: Net Change in Enrollment by Grade Band from SY17-18 to SY18-19 in DC Public Education Sector
Enrollment by grade level
While enrollment was up overall across the city, specific grade levels saw declines. Compared to school year 2017-18 data, the District saw a significant decline in high school enrollment, with 44 fewer 9th graders and 161 fewer 10th graders in DCPS and public charter schools. Despite declining overall enrollment in 11th and 12th grades in the District, public charter schools saw increased enrollment in these grade levels with 33 and 77 more 11th and 12th graders respectively.
The District’s overall increase in enrollment can partially be attributed to the rise in middle school enrollment. The city has seen its total sector enrollment in grades 6-8 increase by 1,500+ students since school year 2016-17, with 533 more 6th graders and 335 more 8th graders enrolling in public charter and DCPS (traditional public schools) in the last year.
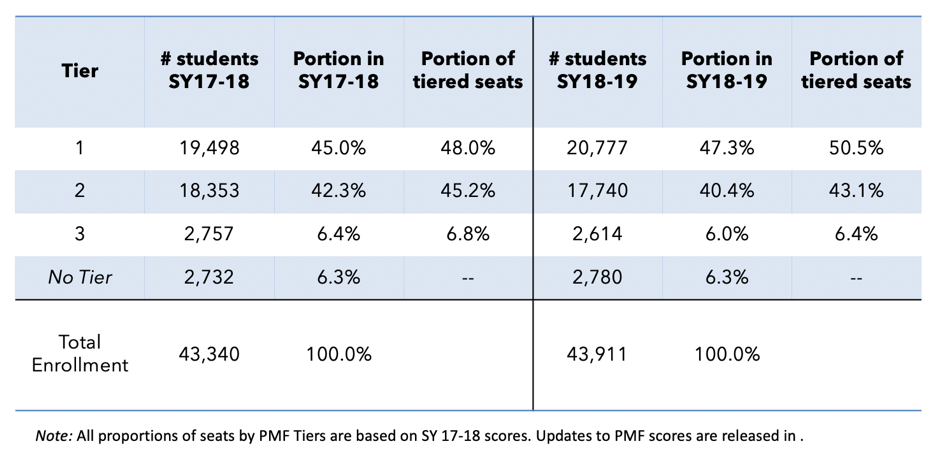
TABLE 5: Portion of students enrolled in DC Public Charter Schools by Tier, School Year (SY) 2017-18 compared to SY18-19.
Public Charter School Enrollment by School Quality Report Tier
DC PCSB uses the Performance Management Framework, or PMF, to assess the academic quality of its public charter schools. The PMF is the basis of the annual School Quality Report that is released annually.
This year’s results saw increases in the proportions of students attending top-ranking Tier 1 schools by 2.3% and a 0.4% decrease in the proportion of students in low-performing Tier 3 schools. As enrollment in the public charter school sector continues to grow, DC PCSB is committed to continuing to grow the proportion of students at top-ranking Tier 1 schools.
TABLE 6: Changes in Enrollment by Ward Share from SY16-17 to SY18-19 in DC Public Education Sector
TABLE 7: Changes in Enrollment by Ward Share from School Year (SY) 2016-17 to SY 2018-19 in DC Public Education Sector
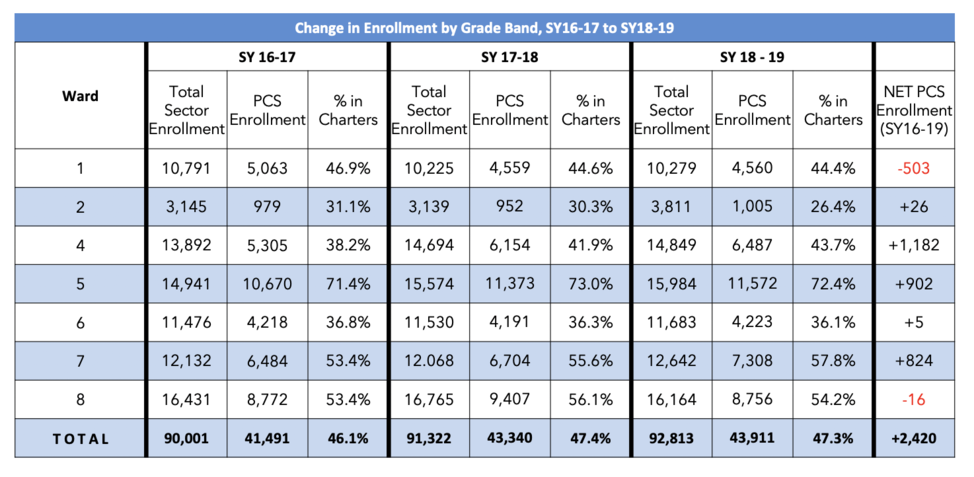
Enrollment by Ward
Enrollment in both public charter schools and DCPS (traditional public schools) increased in Wards 1, 2, 5, and 6 and in Wards 4 and 7 for public charter schools exclusively. Given the opening of new schools and the relocation and closure of existing schools, ward level enrollment is subject to significant changes. The proportion of student attending a public school in Ward 4 has increased by 5% since school year 2016-17, largely due to the opening of District of Columbia International School. The proportion of public school students in Ward 7 has also increased, with 4% more students attending a school in the area since school year 2016-17.
--
This analysis captures changes in enrollment in comparison to the last two school years. Although this year-on-year comparison can sometimes provide a limited snapshot of public charter school growth, it is important to consider in the context of ongoing expansions, closures, and shifts in program offerings. Understanding the District’s supply of and demand for quality schools is crucial in expanding the realm of student achievement and school success.
View the full audited enrollment analysis by clicking here.