Total Student Enrollment Increases in DC Public Charter Schools
DC PCSB uses OSSE’s audited enrollment report and data file along with its own data on school quality to analyze enrollment trends across the District. The analysis of audited enrollment focuses on the total numbers of students in each school and grade level. This year, we also took a closer look at which schools are increasing or decreasing their enrollment at the greatest rates as well as enrollment trends in the highest and lowest performing public charter schools. This analysis compares data from the previous SY16-17 to the current SY17-18.
What is “audited enrollment”? Why does it matter?
In the DC education world, “audited enrollment” refers to the official number of students (along with their demographic characteristics and academic classifications such as grade level or special education program) verified by OSSE’s annual enrollment audit.
The enrollment audit is like an annual census for traditional public and public charter students in the District. This audit is otherwise known as October Count Day. As the State Education Agency, OSSE verifies which students are enrolled in each traditional public and public charter school. This audit is crucial for two main reasons: funding and data verification. Basically, by confirming each student and each school’s enrollment, OSSE ensures that: 1) schools get paid the correct amounts for the students they serve; and 2) education stakeholders across the District have a common, verified dataset (which serves as the foundation for all analyses, projections, strategic planning, and budgeting).
What does this year’s audited enrollment tell us about the trends in education in DC?
This article focuses on three dimensions of this year’s audited enrollment analysis: enrollment by grade band, by grade level, and by School Quality Report Tier (also referred to as the PMF).
Enrollment by grade band
This school year (2017-18) there are 43,340 students enrolled in DC’s public charter schools, an increase of 1,849 students, or 4.5% from the previous school year (2016-17). There are 47,982 students enrolled in traditional public (or DCPS), representing a decrease or 528 students, or 1% of DCPS’ enrollment in SY2016-17. Thus, public charter schools serve 47.5% of the District’s public school students (including students in adult and alternative programs)—up from 46.1% in 2016-17.
Enrollment in public charter schools increased for all grade bands. However, there’s a big difference in the proportions of students in public charter and traditional public (DCPS) schools for different grade bands. For example, public charter schools serve 40% of the District’s public high school students and 82% of adult students (see Table 1). Charter schools serve 45.2% of the District’s PK-12 students (with alternative students counted in their actual grades).
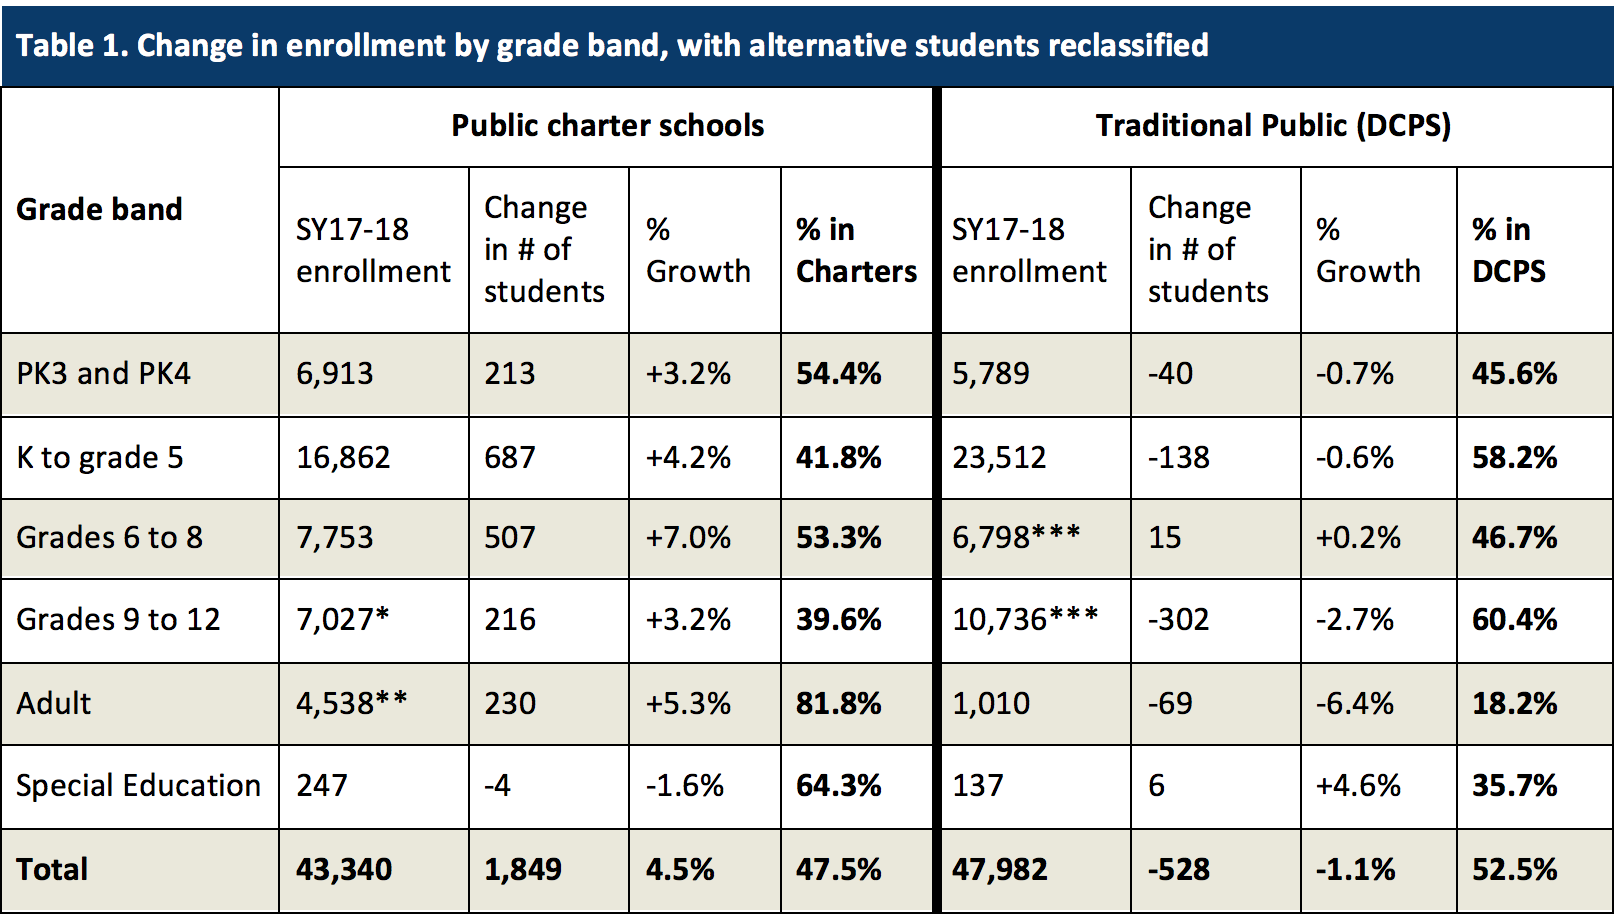
Table notes: *Includes 170 public charter school students reclassified from alternative to HS (Maya Angelou HS). **Includes 670 public charter school students reclassified from alternative to Adult (LAYC, YouthBuild, The Next Step/El Próximo Paso). ***Includes 533 traditional public (DCPS) students reclassified from alternative to HS and n=1 to MS. Five traditional public (DCPS) alternative high schools: Washington Metro, CHOICE Academy at Washington Metro (MS), Youth Services Center, Inspiring Youth Program, Luke C. Moore.
Citywide enrollment by grade level
While enrollment was up overall, specific grade levels saw declines. Compared to 2016-17, the District has 114 fewer Kindergarteners and 456 fewer 9th graders enrolled in its public and public charter schools (see Chart 1). On the other hand, there are 564 more 5th graders and 317 more 7th graders enrolled compared to last year. Some of the biggest changes in enrollment occur in grades where students often change schools: Kindergarten, 5th, 6th, and 9th grade. Seventh grade is an exception to this trend.
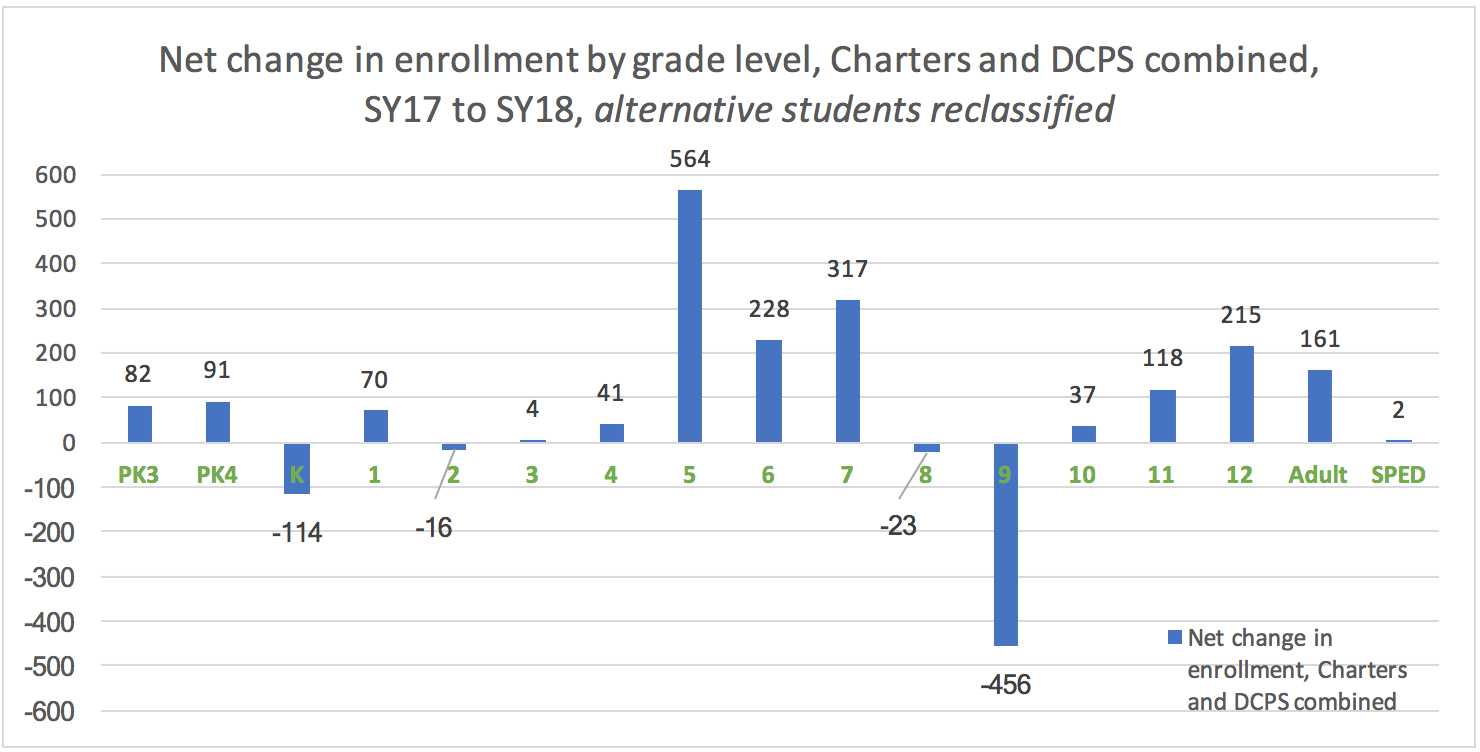 Table notes: *Includes 170 public charter school students reclassified from alternative to HS (Maya Angelou HS). **Includes 670 public charter school students reclassified from alternative to Adult (LAYC, YouthBuild, The Next Step/El Próximo Paso). ***Includes 533 traditional public (DCPS) students reclassified from alternative to HS and n=1 to MS. Five traditional public (DCPS) alternative high schools: Washington Metro, CHOICE Academy at Washington Metro (MS), Youth Services Center, Inspiring Youth Program, Luke C. Moore.
Public Charter School enrollment by School Quality Report Tier
DC PCSB uses the Performance Management Framework, or PMF, to assess the academic quality of public charter schools. The PMF creates our annual School Quality Report that is released in November.
This year, the overall proportion of students attending a public charter school without a PMF score decreased by nearly 50%. This change reflects the fact that 14 schools were open during SY2015-16 but did not have the data to yield a PMF score until the end of school year 2016-17.
However, as more schools receive PMF scores, this year saw increases in the proportions of students in both Tier 1 and Tier 3 schools (see Table 2). As enrollment in the charter sector continues to grow, DC PCSB is committed to continuing to grow the percent of students at Tier 1 schools.
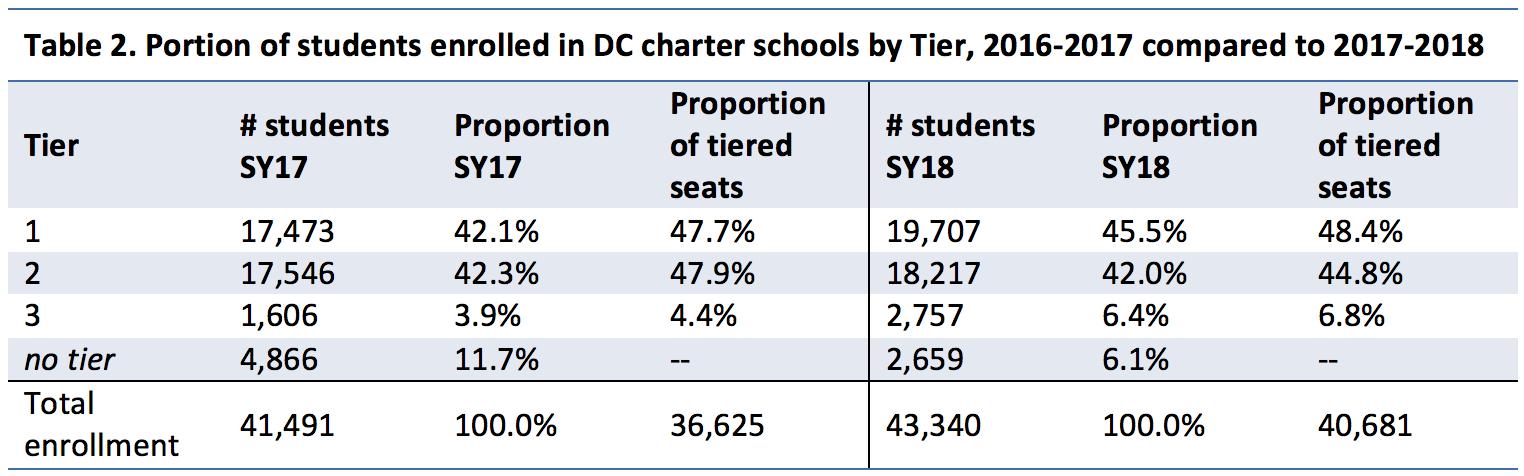
Note: Proportions of tiered seats based on 2017 PMF scores.
What are the implications of this analysis?
Improving student achievement and school quality is long-term work. This analysis summarizes changes in enrollment compared to last year, and this year-on-year comparison provides a limited snapshot of this work. However, when considered along with information about school locations, expansions, closures, and program offerings, the enrollment data provide important insight into the District’s supply of and demand for quality schools.